


 617
617A complete carbon accounting exercise typically involves three essential steps: collecting activity data, selecting carbon emission factors, and preparing the accounting report. Data provides the foundation, the report presents the results, and emission factors convert actual activity data into carbon emissions.
The formula for carbon accounting appears straightforward:
Carbon emissions = Activity data × Carbon emission factor
The amount of raw materials purchased, electricity consumed, or freight transported in tonne-kilometres can be multiplied by the corresponding emission factors to calculate emissions.
The real challenge, however, is usually not the multiplication itself, but selecting the right emission factors.
The same raw material may correspond to more than a dozen factors across different databases. These factors may vary in production processes, geographical coverage, data years, and system boundaries—and their values may differ significantly. Choosing the wrong factor affects more than the final emissions total: it can also change identified emission hotspots, supplier performance assessments, and emission-reduction priorities. Even a result produced through a complete calculation process and reported to four decimal places may lose its management value if the underlying factor is unsuitable.
Factor selection is therefore not merely a database lookup step. It is a professional judgement that determines whether the accounting results are credible.

Why Is Factor Selection Becoming Harder as More Factors Become Available?
Databases are expanding, standards are improving, and companies have access to far more carbon data than before. Yet several problems remain common when selecting factors in real-world projects.
|Looking Only at the Name, Not the Technology
A practitioner may find a factor labelled “steel,” “aluminium,” or “plastic” and use it immediately, without checking whether it represents a blast furnace or electric arc furnace process, virgin or recycled material, a specific material grade, or the applicable production technology.
|Looking Only at the Year or Region, Not the Boundary
A factor may be prioritised because it is newer or geographically closer, while overlooking whether it includes transportation, infrastructure, recycling benefits, the same range of greenhouse gases, or a consistent global warming potential (GWP) version.
|Accepting a Result Without Examining Its Source
A supplier may provide a carbon footprint figure without disclosing the calculation process, activity data, allocation method, or verification basis. The figure is nevertheless treated as primary data.
|Choosing Whichever Factor Produces the Lowest Result
When several candidate factors are available, the value most favourable to the company or product may be selected simply to obtain a lower accounting result.
|Mixing Similar-Looking Factors
An electricity carbon footprint factor and an electricity carbon dioxide emission factor may have similar names but correspond to different accounting boundaries and use cases. If they are not distinguished correctly, both product carbon footprint calculations and purchased-electricity emissions in a corporate inventory may use the wrong accounting basis.

The Standards Already Exist—What Is Missing Is a Clear Decision Chain
Factor selection is not without guidance.
GB/T 24067—2024, Greenhouse Gases—Carbon Footprint of Products—Requirements and Guidelines for Quantification, requires site-specific data to be collected when a company has financial or operational control. Site-specific data should also be prioritised for significant unit processes. Secondary data should be used only when primary data cannot be collected or when the process is of relatively low significance. The standard also requires data quality to be assessed in terms of technological, geographical, and temporal coverage.
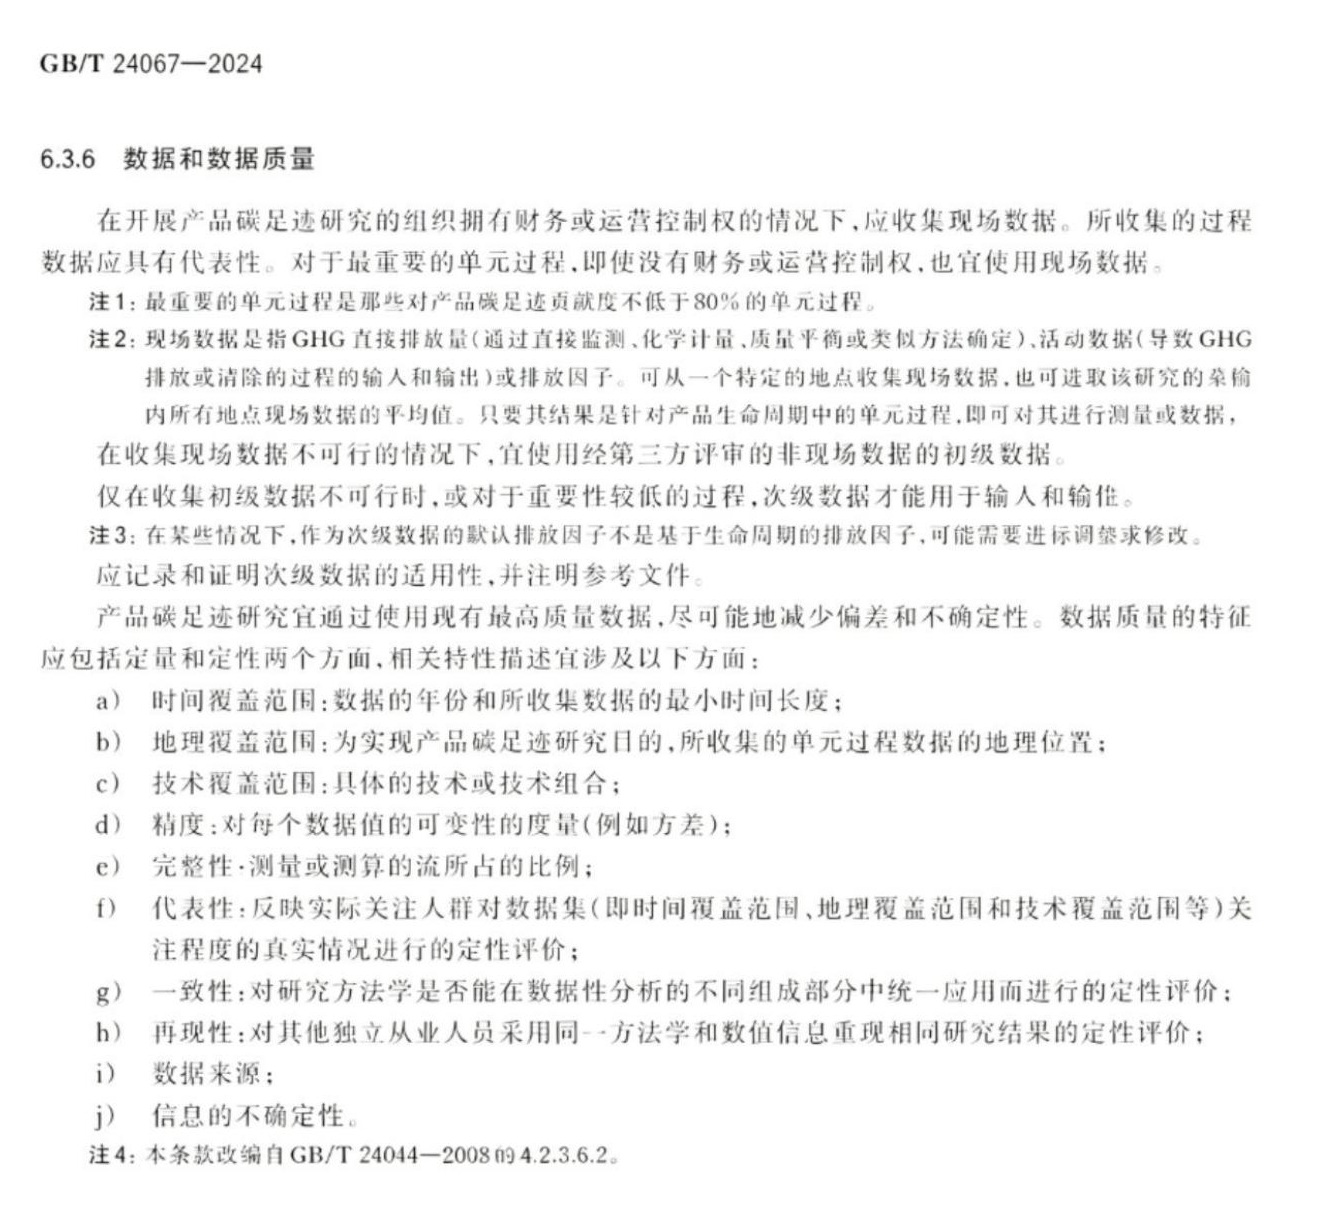
Source: GB/T 24067—2024, Greenhouse Gases—Carbon Footprint of Products—Requirements and Guidelines for Quantification
Internationally, the GHG Protocol Scope 3 guidance also categorises data as primary or secondary. It recommends collecting high-quality primary data for high-priority activities. When primary data is unavailable or of insufficient quality, secondary data may be used and evaluated based on technological, temporal, and geographical representativeness, as well as completeness and reliability.
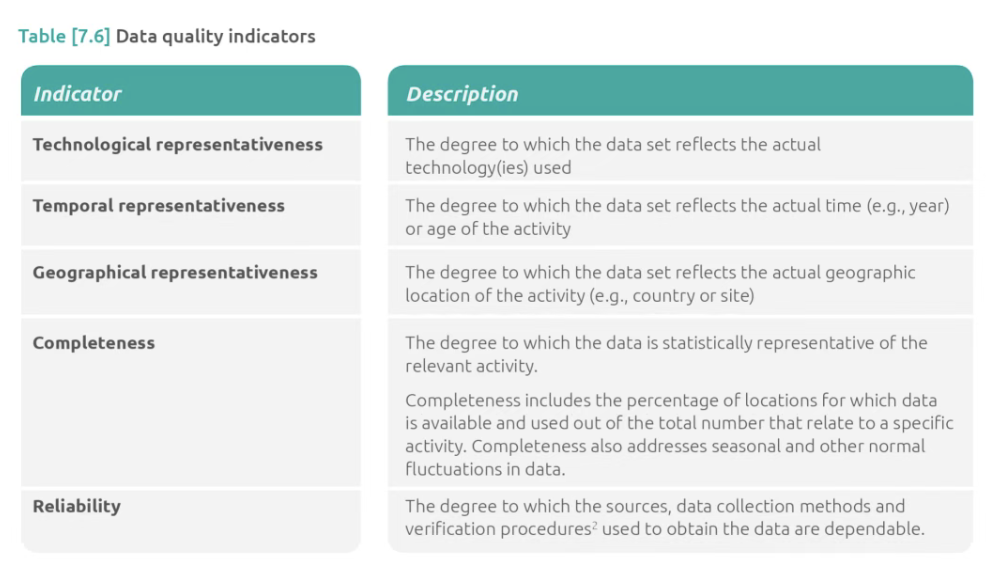
Source: GHG Protocol Scope 3 Guidance
The Guidelines for Developing a Product Carbon Footprint Factor Database, issued by China’s Ministry of Ecology and Environment and other authorities, further specify that primary data should be prioritised when developing emission factor data. Secondary data from statistics, literature, estimates, and other sources may be used appropriately, with assessments of technological, geographical, and temporal representativeness and traceability.
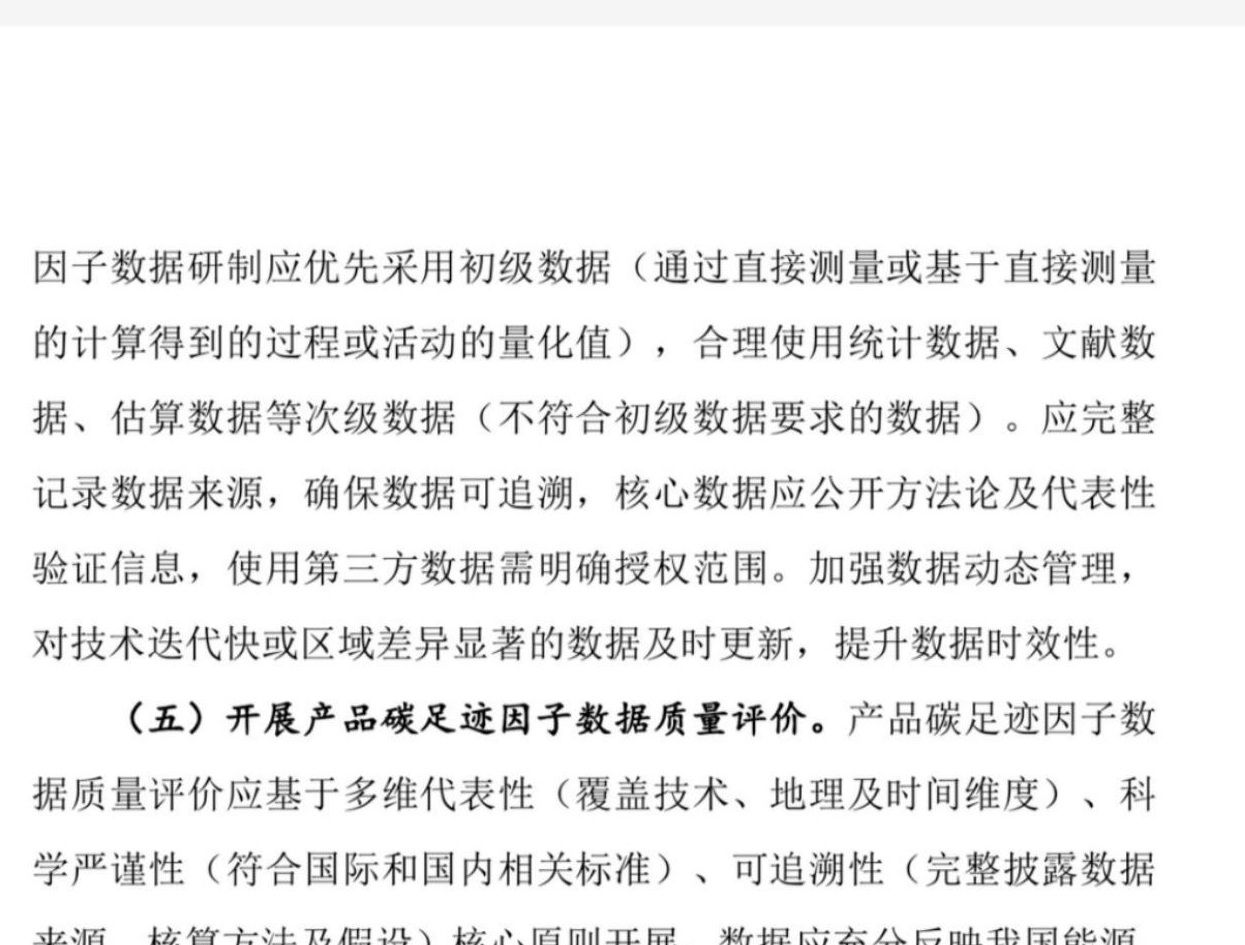
Source: Guidelines for Developing a Product Carbon Footprint Factor Database
The rules become even more detailed in specific certification scenarios. The first batch of dedicated implementation rules for product carbon footprint label certification, issued by the Certification and Accreditation Administration of China, state that secondary data should prioritise carbon footprint factors published by the state or recommended by competent authorities. If no suitable factors are available, practitioners should then consider, in sequence, third-party-verified reports, commercial databases, literature or industry statistics, and data for comparable technologies in other countries. Data quality should also be evaluated using a Data Quality Rating (DQR).
Together, these standards and rules establish several points of consensus:
1. First define the accounting purpose, system boundary, and project requirements.
2. Prioritise qualified primary data whenever it is available.
3. When using secondary data, examine both its source and its applicability.
4. Data quality assessments must consider technological, geographical, and temporal representativeness.
5. The selection process must be documented so that it can be reviewed and reproduced.
The problem is that these requirements are distributed across different standards, product category rules (PCRs), certification rules, and database guidelines. Faced with dozens of candidate factors, project teams still need to translate broad principles into a series of specific decisions.
Drawing on years of experience in carbon accounting, product carbon footprints, and database development, Carbonstop has organised these shared principles into a more practical decision chain: the PSTGT Carbon Emission Factor Selection Rule.
PSTGT consists of five elements:
• P — Primary Data
• S — Secondary Data
• T — Technological Representativeness
• G — Geographical Representativeness
• T — Temporal Representativeness
Rather than averaging scores across five indicators, PSTGT applies them sequentially:
First, look for qualified P. If no qualified P is available, screen S. When several S candidates remain, compare their T-G-T representativeness.


P: Prioritise Primary Data—but Only Qualified Primary Data
Primary data comes directly from the subject being assessed. Examples include emissions derived from energy consumption measured at a factory or clearly documented carbon emissions data supplied for a specific product. Because primary data more closely reflects actual production activities, it should be prioritised.
Consider an automotive components company purchasing aluminium. Its supplier provides a product carbon footprint report for the specific grade of aluminium, detailing the production location, reporting period, process route, proportion of recycled material, allocation method, and verification status. Compared with an average Chinese aluminium factor from a database, this supplier-specific dataset is more representative of actual emissions and should be considered first.
However, if the supplier merely states in an email that “each tonne of aluminium produces three tonnes of carbon dioxide equivalent,” without providing the boundary, data year, or calculation basis, the figure cannot be treated as qualified primary data.
At a minimum, four questions should be answered before primary data is accepted:
• How was the data obtained?
• What are its boundary and unit?
• Are the calculation and allocation methods clearly defined?
• Can the original records be traced?
If the result deviates significantly from typical industry levels, further review is also required.
Prioritising P means prioritising qualified data that more closely represents the actual scenario—not accepting every figure supplied by the company itself.

S: When Qualified Primary Data Is Unavailable, Turn to Secondary Data
When primary data is unavailable or does not meet quality requirements, the process moves to S: screening secondary data.
Where applicability is comparable, PSTGT recommends considering the following sources in sequence:
1. Data specified by the applicable accounting rules, as well as data published through national standards, national platforms, or competent authorities.
2. Authoritative databases recognised by the project rules, such as ecoinvent, DEFRA, and the IEA.
3. Other commercial databases, industry databases, or data from authoritative institutions.
4. Environmental Product Declarations (EPDs), academic literature, and other traceable sources.
When regulations, standards, PCRs, or customers prescribe particular factors and methodologies, those requirements should be followed first. However, data should not be adopted solely because it comes from an influential institution if its technology or system boundary is clearly inconsistent with the activity being assessed.
Consider electricity used in a domestic product carbon footprint assessment. If the project needs to calculate the lifecycle emissions of electricity consumption and no more specific project rule or company-specific data is available, the national electricity carbon footprint factor published by China’s Ministry of Ecology and Environment will generally take precedence over default China electricity data from an overseas database. It is issued by the competent authority, represents China’s electricity system, and has an accounting boundary aligned with product carbon footprint applications.
In practice, companies must perform two checks: first examine where the data comes from, and then determine whether it is suitable for the scenario. Neither check can be omitted.

T-G-T: Which Factor Best Represents the Real-World Scenario?
After source screening and eligibility checks, several candidate factors may remain. As a general rule, PSTGT compares them in the following order:
Technological representativeness > Geographical representativeness > Temporal representativeness
|T: First, Check Whether the Production Technology Matches
Technological representativeness considers the type of raw material, production process, technology route, and energy mix.
Suppose a company purchases electric arc furnace steel produced in China. Its candidate factors include current-year data for overseas blast furnace steel, three-year-old data for Chinese electric arc furnace steel, and a global average steel factor. If all three satisfy the relevant system-boundary and data-quality requirements, the three-year-old Chinese electric arc furnace factor should generally be prioritised.
Blast furnace–basic oxygen furnace production and electric arc furnace production differ significantly in their raw material structures and emissions profiles. Matching the technology route is more important than simply selecting the newest data.
Similarly, when accounting for recycled plastic, a candidate factor representing virgin plastic production cannot substitute for an assessment of the recycling process—even if its region and data year are suitable.
|G: Next, Check Whether the Data Comes from the Right Location
Geographical representativeness should be determined by the actual production location—not the purchasing location, the trader’s registered location, or the location where the material is ultimately used.
Suppose a Shanghai-based company purchases natural rubber produced in Southeast Asia through a domestic trader. The raw material’s production location remains the main basis for assessing geographical representativeness. Using average agricultural data for Shanghai or China may appear geographically closer to the buyer, but it does not represent the actual conditions under which the rubber was grown and processed.
Electricity, agriculture, and waste treatment are especially sensitive to geography. Regional differences in electricity mixes, climate, resource conditions, and treatment technologies can be significant. In these cases, G may be assigned a higher priority.
|T: Finally, Check Whether the Data Is Close to the Accounting Period
Temporal representativeness requires the data year to be as close as reasonably possible to the accounting period. This does not mean that newer data is automatically better.
If a 2025 dataset represents a completely different production process while a 2022 dataset matches the company’s actual process route, the latter will generally be more appropriate.
Older data should not be considered invalid based solely on its year. The rate of technological change and the results of DQR or Data Quality Scoring (DQS) should also be considered.
For rapidly evolving technologies such as photovoltaics and batteries, a difference in data year may correspond to significant changes in efficiency, energy consumption, and material systems. Temporal representativeness should therefore receive greater weight. PSTGT provides a general sequence while preserving room for industry-specific professional judgement.


Applying PSTGT to a Complete Factor-Selection Process
The practical process can be divided into six steps.
|Step 1: Define the Requirements
Determine whether the project concerns an organisational carbon inventory, product carbon footprint, EPD, Carbon Border Adjustment Mechanism (CBAM), or Scope 3 management. Check all applicable requirements concerning emission factors under regulations, standards, PCRs, and customer rules.
|Step 2: Look for P
Determine whether data from the company or its suppliers is authentic, complete, and traceable. Prioritise it if qualified; otherwise, proceed to secondary-data screening.
|Step 3: Build an S Candidate Pool
Identify candidate factors from prescribed datasets, competent-authority data, databases recognised by the project, and other reliable sources.
|Step 4: Perform Eligibility Checks
Review the product and production technology, system boundary, unit, GWP version, greenhouse gas coverage, transportation, and recycling processes. Exclude factors with clear conflicts before moving to comparison.
|Step 5: Compare T-G-T
In general, compare technology first, geography second, and time third. Weightings may be adjusted for electricity, agriculture, waste treatment, and rapidly evolving technologies.
|Step 6: Evaluate and Document
Use DQR or DQS assessments to evaluate completeness, reliability, and traceability. Retain records of all candidate factors, reasons for exclusion, the rationale for the final selection, and any manual adjustments.
The complete decision chain can be summarised as follows:
Accounting requirements → P: Primary data → S: Secondary data → T: Technological representativeness → G: Geographical representativeness → T: Temporal representativeness → Data quality assessment and review

The Boundaries of the Rule: No Deliberate Low-Value Selection, No Double Counting, and No Avoidance of Review
PSTGT helps project teams identify more applicable factors, but several boundaries must always be observed.
The numerical value of a factor is the outcome of the screening process—not its objective. A lower value must not be deliberately selected from several candidates simply to produce a smaller product carbon footprint.
System boundaries must remain consistent. When the actual transportation mode and distance are known, a factor that excludes transportation should be prioritised, with transportation emissions calculated separately. If transportation is already included in a factor, it must not be calculated again. For recycled materials and end-of-life recovery, teams must also check whether recycling benefits have been counted more than once.
The rule cannot replace professional review. When the technology route or boundary is unclear, candidate factors differ substantially, supplier data appears abnormal, or the assessment involves regulatory interpretation or recycling allocation, professional judgement must supplement the rule and each case should be evaluated individually.
The system must retain more than the factor ultimately selected. It should also preserve the candidate factors, reasons for exclusion, data quality evaluations, and manual adjustments. This ensures that the selection process can still be explained and reproduced when project personnel change, the assessment is updated in a later year, or the results undergo third-party verification.

From a Methodological Rule to Carbon Agent
The rule addresses the question of how factors should be selected. Companies must also solve another practical problem: how can the rule be applied consistently when an assessment involves hundreds or thousands of materials and emission sources?
Through years of serving companies across different industries, Carbonstop has continued to develop its accounting models, industry expertise, and emission factor data. Building on this experience, Carbonstop established the China Carbon Database (CCDB) and launched Carbon Agent.
Carbon Agent can currently access more than 300,000 carbon emission factors, helping companies collect data, build accounting models, match emission factors, and perform logical validation.
PSTGT also provides one of the underlying rule frameworks Carbon Agent uses to match and recommend factors. Instead of returning a value based solely on the material name, the Agent screens candidate factors by considering the accounting purpose, data source, technology route, production region, and data year. When it identifies a boundary conflict, abnormal unit, or insufficient information, it prompts the user to supply additional information or refers the case for human review.
For example, if a user asks it to “calculate the full-lifecycle carbon footprint of an energy-storage battery manufactured at a factory in China,” the Agent can help identify lifecycle stages and emission sources, establish a product carbon footprint model aligned with ISO 14067 and other requirements, and match candidate data from the factor database.
For electricity data, it first determines whether the task concerns a product lifecycle assessment or purchased-electricity emissions in a corporate inventory. For cathode materials, it continues by identifying the material chemistry, production region, and reporting period rather than stopping at keyword matching.
This is the value of combining industry experience, structured rules, and AI: the decision pathways used by experts are embedded into the system, allowing large volumes of repetitive work to be automated while reserving genuine anomalies and disputes for professional judgement.
Select the right factors, and carbon emissions can be calculated accurately.
Through PSTGT and Carbon Agent, Carbonstop aims to help companies understand which data to use when facing complex carbon accounting tasks—and clearly explain why that data was selected.
References
1. GB/T 24067—2024, Greenhouse Gases—Carbon Footprint of Products—Requirements and Guidelines for Quantification
2. GHG Protocol: Scope 3 Data Selection and Quality Assessment
3. Guidelines for Developing a Product Carbon Footprint Factor Database
4. Certification and Accreditation Administration of China: First Batch of Dedicated Implementation Rules for Product Carbon Footprint Label Certification (Trial)
5. Ministry of Ecology and Environment and other authorities: 2024 Electricity Carbon Footprint Factor Data
6. Ministry of Ecology and Environment and National Bureau of Statistics: 2023 Electricity Carbon Dioxide Emission Factors
7. Ministry of Ecology and Environment: Differences in the Applications of Electricity Carbon Footprint Factors and Electricity Carbon Dioxide Emission Factors
8. Carbonstop: Carbon Agent


